Triathlon Training Load with ECOs: How to Track Swim, Bike, and Run

A two-hour easy ride and a two-hour easy run are not the same day. Every triathlete knows it the next morning, in the legs. Most coaches plan around it without thinking twice: the long ride goes on Saturday, the long run gets its own day, and nobody would swap them hour for hour.
The trouble starts when you try to add the week up. Twelve hours of training tells you how long an athlete was busy. It says nothing about how much of that time was spent in the pool, on the bike, or on legs that had just come off the bike. As a result, two twelve-hour weeks can land very differently on the same athlete.
Triathlon training load needs a number that respects those differences. ECOs (Objective Load Equivalents) was built for exactly that job. It weights every minute by how hard it was and by which sport it was, so swim, bike, and run add up to one total that means something. In addition, it adjusts for bricks and races, where the second sport costs more than it would on fresh legs.
This guide explains how ECOs works for triathlon, how to read bricks and race days, and what published triathletes actually log each week across distances and levels. For coaches, it is a way to compare athletes and weeks on one scale. For self-coached athletes, it is a way to see what a week really cost.
Key Takeaways
- ECOs multiplies minutes in each of eight zones by a zone score (1 to 50) and an exercise factor (run 1.0, swim 0.75, bike 0.5), so a 60-minute easy run and a 2-hour easy ride both score 60.
- When the bike follows the swim or the run follows the bike, the exercise factor rises to 0.6 and 1.15, so bricks and races score higher than the same sessions done fresh.
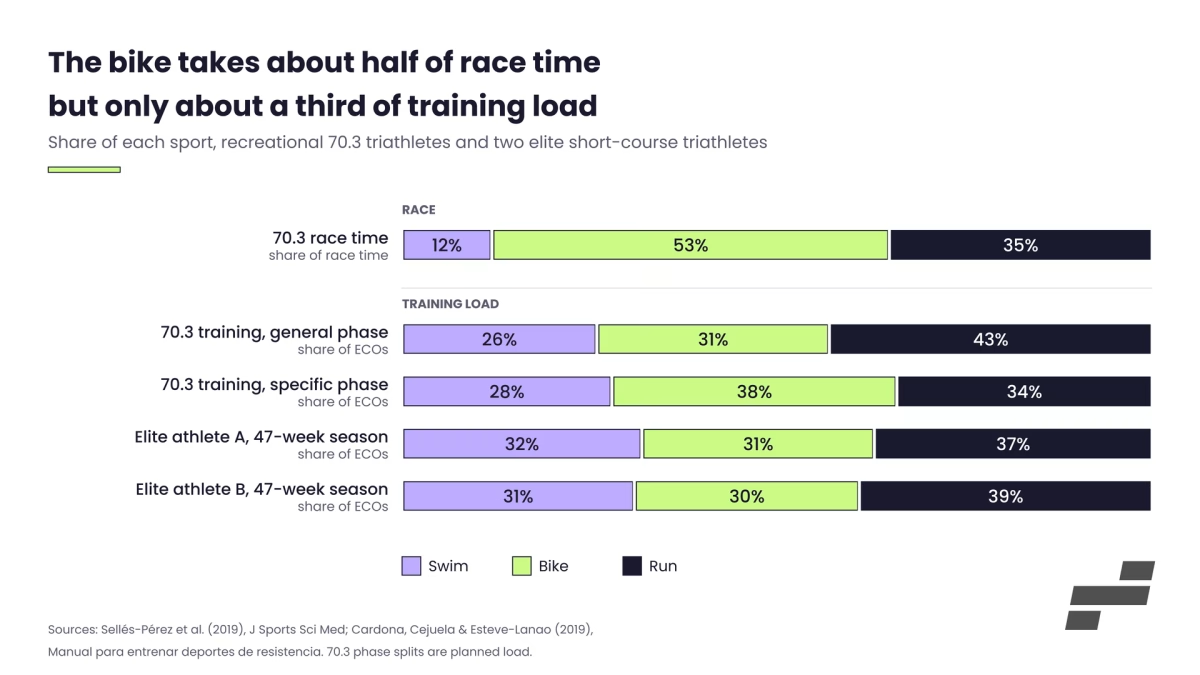
- Over a full season, two elite short-course triathletes logged close to a third of their ECOs in each sport (swim 31 to 32%, bike 30 to 31%, run 37 to 39%), even though the bike takes about half of race time.
- Recreational Ironman athletes averaged 834 ECOs a week over their last 16 weeks; a world-class Olympic-distance triathlete averaged 1,186, with a peak week of 1,757.
- Marathon training produced about 99 ECOs per hour, while every triathlon group studied landed between 63 and 80, mostly because so many triathlon hours are on the bike or in the pool.
- ECOs measures the work done, so pairing it with how the athlete rates each session is what shows how that work is being absorbed.
What ECOs Measures in Triathlon Training Load
ECOs is a training load score that puts swim, bike, and run on one scale. For each session, it takes the minutes spent in each of eight intensity zones, multiplies them by a score for that zone, then multiplies by an exercise factor for the sport. The result is a single number per session, so a week of three sports adds up to one meaningful total.
ECOs = time in zone (minutes) × intensity factor × exercise factor
The intensity factor climbs steeply: 1, 2, 3, and 4 for the four zones up to threshold, then 6, 9, 15, and 50 for the zones above it. That curve is deliberate. A minute well above threshold costs far more than a minute of easy aerobic work, and the score reflects it.
Roberto Cejuela and Jonathan Esteve-Lanao published the method in 2011, in a paper on training load quantification in triathlon. Their goal was a scale that handled three sports and the transitions between them, which most load scores were never designed to do. For the full zone breakdown and how each one is anchored, see ECOs Training Load Explained.
Why Swim, Bike, and Run Score Differently
Running is the reference sport at 1.0. Swimming is weighted at 0.75 and cycling at 0.5. In other words, a minute of running in a given zone counts twice as much as the same minute on the bike.
The factors come from four things the authors scored for each sport on a simple 1 to 4 scale. The first is how hard it is to hold good technique, which is highest in the water. The second is muscle soreness, which is highest for running because of the impact. The third is how continuous a typical session is: runs rarely stop, rides have descents and drafting, and swim sets are full of short rests. The fourth is energy cost. Running scored 12 of a possible 16, swimming 9, and cycling 6, which gives the 1.0, 0.75, and 0.5.
The result matches what coaches see. For example, a 60-minute easy run scores 60 ECOs (60 × 1 × 1.0). A 2-hour easy ride also scores 60 (120 × 1 × 0.5). Most triathletes would recognize those two sessions as similar days, and the score treats them that way.
Swimming follows the same logic. Take 20 minutes of easy swimming plus 20 minutes of threshold repeats. The easy part scores 15 (20 × 1 × 0.75) and the threshold part scores 60 (20 × 4 × 0.75), so the session totals 75. That example comes straight from Esteve-Lanao and colleagues (2017), who used ECOs to compare Ironman and marathon training.
💡 Coaching tip: The bike’s lower factor does not mean riding is easy. It means an hour on the bike usually leaves less residual fatigue than an hour of running at the same intensity. That is exactly why triathletes can ride far more hours than they could ever run, and why the bike tends to dominate a triathlete’s training time.
Bricks and Races: How Transition Coefficients Change Triathlon Training Load
In ECOs, a sport done straight after another sport scores higher than the same work done fresh. The bike’s exercise factor rises from 0.5 to 0.6 when it follows the swim, and the run’s rises from 1.0 to 1.15 when it follows the bike. The swim never changes, because nothing comes before it. Only the second sport in a sequence, and any after it, gets the higher factor.
The authors based those numbers on research into running after cycling, the transition that matters most. Running off the bike costs more energy, feels harder at the same pace, and changes how the legs move (Millet and Vleck, 2000). Consequently, a brick run carries more load than the same run by itself on a Tuesday, and the score now says so.
A Worked Brick
Take a common build-phase brick: a 90-minute ride with 30 minutes at tempo, then a 30-minute run at the same effort.
- The ride scores 75: 60 minutes in Zone 1 (60 × 1) plus 30 minutes in Zone 3 (30 × 3), times 0.5.
- The run on fresh legs would score 90 (30 × 3 × 1.0).
- Off the bike, it scores 103.5 (30 × 3 × 1.15).
The session totals 178.5 ECOs instead of 165, about 8% more. That gap is small on one day. Across a block with two bricks a week, however, it is the difference between a load curve that reflects the specific phase and one that quietly under-reports it.
EndoGusto applies these coefficients when a brick or race is recorded as a single multisport activity on the athlete’s device. A ride and a run saved as two separate files score as two standalone sessions, so recording bricks in multisport mode is what lets the transition show up in the numbers.
What a Race Day Scores
Race day is where transitions matter most, because every sport after the swim is a second or third event. As an illustration, take the average finish times of the recreational athletes in a Half-Ironman study by Sellés-Pérez and colleagues (2019): about 41 minutes to swim, 184 to ride, and 121 to run.
Assume a steady Zone 3 swim, a Zone 2 ride, and a Zone 3 run. The swim scores about 92, the ride about 221, and the run about 418, for roughly 730 ECOs. Without the transition coefficients, the same race would score about 639.
Two things stand out. First, the run is about 35% of race time but about 57% of race-day load. Second, 730 ECOs is roughly what those same athletes logged in an entire average training week. A mid-distance triathlon is a full week of load in a single morning, which is a useful number to have when planning the days after it.
💡 Coaching tip: Zone assumptions drive race estimates. An athlete who rides the 90 km in Zone 3 instead of Zone 2 adds about 110 ECOs to the bike alone, before the run even starts.
How Load Splits Across the Three Sports
In the published ECOs data, triathletes spread their training load close to evenly across swim, bike, and run. The clearest example comes from the training manual written by the method’s authors: over a 47-week season, two elite short-course training partners logged 32% and 31% of their ECOs swimming, 31% and 30% cycling, and 37% and 39% running (Cardona, Cejuela, and Esteve-Lanao, 2019). In the 70.3 study, the specific preparation phase was planned at 28% swim, 38% bike, and 34% run. Similarly, three elite under-23 women followed through a full season carried almost equal load in each leg nearly every week, with swim and run level and the bike slightly lower.
Time Split Versus Load Split
That even split hides a very uneven use of time. In the same 70.3 study, race time broke down to about 12% swim, 53% bike, and 35% run. The bike takes the most hours, yet once the exercise factors are applied, it carries roughly a third of the load.
For a coach, this is the most practical thing ECOs adds to triathlon. An athlete can spend half the week on the bike and still have the run producing as much load as the ride. Looking at hours alone, that week reads as bike-heavy. Looking at ECOs, it reads as balanced, which is closer to how the athlete’s body experiences it.
What a Lopsided Split Tells You
A split that moves on purpose is planning at work. In the 70.3 study’s general phase, for instance, the run carried 43% of the load. The split then shifted toward the bike as the specific race preparation began.
A split that moves without a plan behind it is worth a second look. Run load creeping past half of the week during a block meant to build the bike usually means extra or faster runs crept in. Swim load dropping steadily often means sessions are being skipped. In both cases, the per-sport trend shows it before the athlete mentions it.
Real ECOs Numbers Across Distances, Levels, and Seasons
Published ECOs studies give a rare look at what real athletes log each week. Recreational long-course triathletes cluster around 750 to 850 ECOs a week, while elite and world-class short-course triathletes average roughly 1,000 to 1,300 and reach about 2,000 in their biggest weeks. The table below gathers published ECOs scores for triathletes, with marathoners for comparison.
| Athletes | Goal race | Weekly hours | Average week (ECOs) | Biggest weeks (ECOs) |
| 15 recreational marathoners (2017) | Marathon, about 3:06 | 5.2 | 526 | 838 |
| 13 recreational triathletes (2019) | 70.3, about 5:46 | 11.9 | 752 to 785 | Not reported |
| 15 recreational triathletes (2017) | Ironman, about 11:45 | 12.9 | 834 | 1,346 |
| 3 elite under-23 women (2024) | Sprint and Olympic | Over 10 | Not reported | 1,176 to 1,361 |
| 2 elite training partners, one 47-week season (Cardona, Cejuela, and Esteve-Lanao, 2019) | Short course | 17 and 14 | 1,135 and 1,033 | 2,108 and 1,889 |
| 1 world-class man, Tokyo 2020 (2022) | Olympic | 14.7 | 1,186 | 1,757 |
| 2 men followed from junior to world-class (2023) | Olympic | Not reported | 1,200 to 1,300 | About 2,000 (2,246 in 2022) |
The biggest-week figure for the marathon and Ironman groups is the average of each athlete’s own peak.
A training group of 20 national and international elite triathletes adds a useful reference. Their coaches treated a week as heavy above 1,125 ECOs for national-level athletes and above 1,500 for international-level athletes, and as light below roughly 750 and 980 (Cejuela et al., 2026). Each group’s bands were set around its own typical week, not a universal number.
Load Per Hour Tells a Different Story
Divide load by hours and the ranking changes. The marathoners produced about 99 ECOs per training hour. Every triathlon group sat well below that: about 63 to 66 for the 70.3 group, 66 for the Ironman group, 67 and 72 for the elite training partners, and about 80 for the world-class Olympic-distance athlete.
Most of that gap comes from the exercise factors. A runner’s hour always counts at 1.0, while much of a triathlete’s week is on the bike at 0.5 or in the pool at 0.75. Intensity still shows at the margins: the elite short-course athletes score a little more per hour than the recreational long-course groups. As a result, a bigger triathlon week is not automatically a harder one, and two athletes on the same weekly total can be doing very different training.
Easy Minutes, Hard Load
About 80% of the world-class athlete’s training time was in the easiest zones. Yet only about half of his ECOs came from those zones, and the other half came from the 20% of time spent harder. The elite training partners in the manual show the same pattern: 87% and 88% of their hours were easy, but those hours produced only 45% and 50% of their ECOs. The two junior-to-world-class athletes and the under-23 women landed near the same 50/50 split.
That gap is the intensity curve at work. Every minute above threshold scores several times more than an easy one, so a small amount of hard training carries a large share of the load. The authors suggest that easy-zone load roughly matching the load from everything harder may describe a balanced week better than time percentages do. For a coach, this means the quality sessions deserve as much attention in load planning as the long ones.
How Load Moves Across a Season
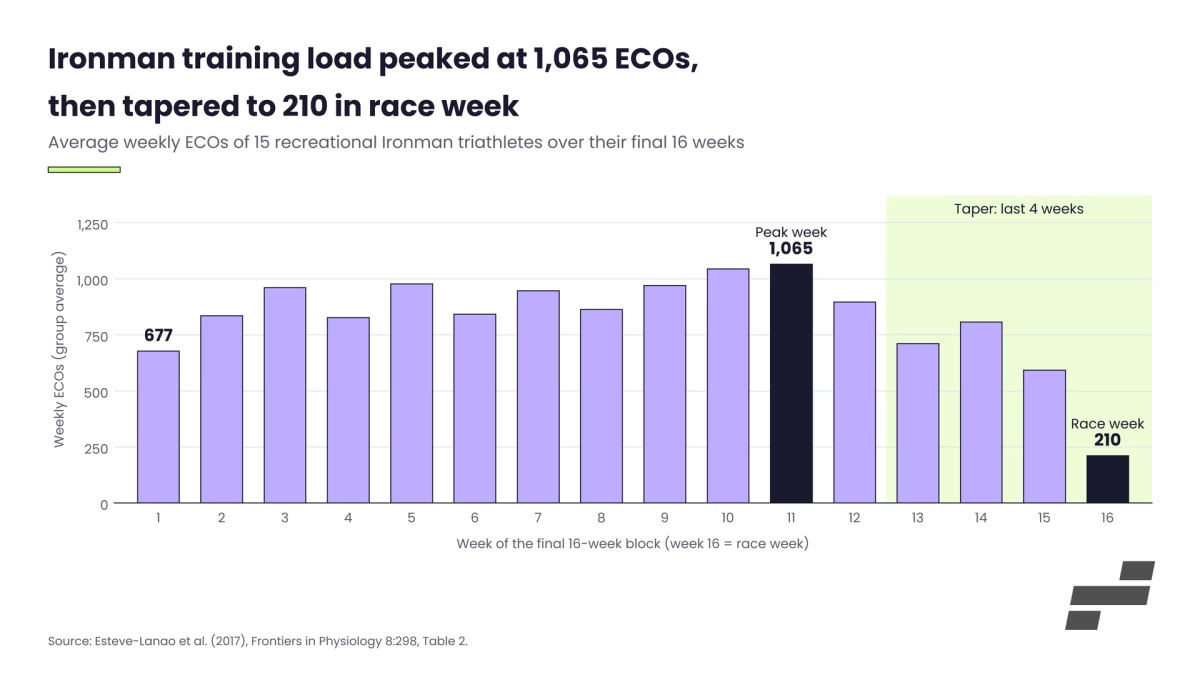
The Ironman group’s last 16 weeks show the shape clearly. Load started at 677 ECOs, was planned in three-week builds with a lighter fourth week, and peaked at about 1,065 in week 11. It then dropped through the taper to 592 in week 15 and 210 in race week.
That three-hard, one-easy rhythm matches what the authors’ manual recommends for experienced athletes and longer events, since it lets more load build before each down week. For beginners, or for shorter events with no races on the calendar, it suggests two hard weeks before each easy one.
The manual’s worked example of a two-peak season shows the pattern twice. A triathlete builds for 13 weeks to an Olympic-distance race, drops through a few very light weeks, then builds again for a Half Ironman 14 weeks later. The second block climbs to a higher peak than the first, and the two sprint races inside the first block land in full training weeks rather than lighter ones.
The Tokyo athlete’s 43-week season shows something the weekly total hides. His swim load peaked in week 15, his run load in week 34, and his bike load in week 37, so each sport had its own build inside one plan. Tracking ECOs by sport makes that visible. Tracking the total alone would show one smooth hill.
These numbers come mostly from one research group in Spain, coaching mostly male athletes, so they are reference points rather than targets. Above all, the most useful comparison is always an athlete against their own past seasons.
Using ECOs Week to Week
The most useful ECOs number is the one an athlete produced last month. A 900-ECOs week means little on its own; it means a lot as 15% above the athlete’s recent average, or as the first week back to that level after an injury. Therefore, the trend line matters more than any single week. For reading those trends over time, see Reading Your Performance and Training Load Balance Graphs.
Build in Steps, Then Back Off
The elite group behind several of these studies followed a simple rhythm. In development weeks, load rose 10 to 15% over the week before. In recovery weeks, it dropped 20 to 25% (Arévalo-Chico et al., 2024). That is a coaching rule from one group, not a law, but it gives a concrete starting point for planning a block in ECOs instead of in hours.
The authors’ manual applies the same idea to single sessions. Each zone’s key sessions should progress from one to the next, for example a Zone 3 session worth 54 ECOs followed by one worth 60. Only the main set counts toward that number; the warm-up and cool-down are left out.
Watch Each Sport, Not Only the Total
A steady weekly total can hide a sport that is drifting. If the total holds at 800 while the run climbs from 270 to 400, the athlete is doing a very different week, and the legs will know it. Reviewing swim, bike, and run load side by side each week catches that shift early.
Pair the Number With How the Session Felt
ECOs measures the work that was done. It does not measure how the athlete absorbed it, and the original authors were clear about that. Alongside ECOs, they asked athletes to rate each day from 0 (rest) to 5 (race-level effort). In their view, training is landing well when the work keeps rising while those ratings rise at first and then level off.
Recent research supports pairing the two. In a study of elite triathletes followed over four seasons, how hard athletes said their training felt tracked a blood marker of fatigue (urea) more closely than ECOs did. Athletes who rated their sessions as easier, relative to the ECOs they were doing, showed smaller rises in that marker (Cejuela et al., 2026). In other words, the same 1,200-ECOs week can be productive for one athlete and too much for another, and the athlete’s own rating is what tells them apart.
💡 Coaching tip: When an athlete’s ratings climb for two or three weeks while ECOs hold steady, the plan has not changed but the athlete has. That is the moment to look at sleep, life stress, and recovery before adding more load.
Where the Numbers Lead
A triathlete’s season is three sports sharing one body, and ECOs is a way to see that body’s whole workload in one place. The long ride, the brick run, and the threshold swim each get their honest share. As a result, a coach can see when the run is quietly taking over a block, when race day will cost a full week of load, and when an athlete’s ratings say the same numbers have started to land harder.
With that picture, each week can be set against the last one, adjusted to what the athlete is absorbing, and built toward a start line they reach fit, fresh, and ready to race.
Track Triathlon Training Load in EndoGusto
A coach can hold one athlete’s three-sport week in their head. Across a full roster, it becomes a different job. EndoGusto calculates ECOs for every synced session, splits it by swim, bike, and run, and applies the transition coefficients to bricks and races recorded as multisport activities, so the whole roster’s triathlon training load sits on one scale. The Training Arc then lays out each athlete’s season from base to race day, so every week’s numbers have a plan to be read against.
Track Your ECOs Load Across Swim, Bike, and Run
Suggested References
- Arévalo-Chico H, Sellés-Pérez S, Cejuela R. Applying a holistic injury prevention approach to elite triathletes. Sports. 2024;12(8):225. doi:10.3390/sports12080225
- Cardona C, Cejuela R, Esteve-Lanao J. Manual para entrenar deportes de resistencia. Madrid: Editorial Princesa; 2019.
- Cejuela R, Arévalo-Chico H, Sellés-Pérez S. Dose–response to endurance training: a longitudinal study of training load and biomarkers in elite triathletes. Frontiers in Physiology. 2026;17:1767378. doi:10.3389/fphys.2026.1767378
- Cejuela R, Esteve-Lanao J. Training load quantification in triathlon. Journal of Human Sport and Exercise. 2011;6(2):218–232. doi:10.4100/jhse.2011.62.03
- Cejuela R, Sellés-Pérez S. Road to Tokyo 2020 Olympic Games: training characteristics of a world class male triathlete. Frontiers in Physiology. 2022;13:835705. doi:10.3389/fphys.2022.835705
- Cejuela R, Selles-Perez S. Training characteristics and performance of two male elite short-distance triathletes: from junior to “world-class”. Scandinavian Journal of Medicine & Science in Sports. 2023;33:2444–2456. doi:10.1111/sms.14474
- Esteve-Lanao J, Moreno-Pérez D, Cardona CA, et al. Is marathon training harder than the Ironman training? An ECO-method comparison. Frontiers in Physiology. 2017;8:298. doi:10.3389/fphys.2017.00298
- Millet GP, Vleck VE. Physiological and biomechanical adaptations to the cycle to run transition in Olympic triathlon: review and practical recommendations for training. British Journal of Sports Medicine. 2000;34(5):384–390. doi:10.1136/bjsm.34.5.384
- Sellés-Pérez S, Arévalo-Chico H, Fernández-Sáez J, Cejuela R. Training characteristics, performance, and body composition of three U23 elite female triathletes throughout a season. Sports. 2024;12(2):53. doi:10.3390/sports12020053
- Selles-Perez S, Fernández-Sáez J, Cejuela R. Polarized and pyramidal training intensity distribution: relationship with a Half-Ironman distance triathlon competition. Journal of Sports Science & Medicine. 2019;18(4):708–715.