Training Zones Explained: What the Science Defines and How Coaches Apply It

A training zone is a line we draw on something that has no lines in it. Effort moves along a continuous metabolic gradient, and the body slides along it without ever stopping at a marked boundary. At the easy end, aerobic metabolism supplies nearly all the energy. As intensity rises, anaerobic pathways contribute a growing share, though the aerobic system keeps working the whole way up and never shuts off. Fat oxidation gives way to glycolysis by degrees. Lactate production rises and clearance falls along a smooth curve, not a step. There is no point in the muscle where one zone ends and the next begins.
Training zones take that gradient and make it usable. They turn a continuous, invisible process into something a coach can prescribe and an athlete can target. That translation is why zone training works across every endurance sport. A swimmer, a cyclist, and a runner are all moving along the same physiological spectrum, governed by the same thresholds, even though the numbers on their watches look nothing alike.
The catch is that a zone is only ever as good as the anchor it’s built on. The science fixes the landmarks, the points where the balance between energy systems shifts. What it doesn’t fix is how many zones you draw around those landmarks, or which measurement you use to find them. Those are coaching decisions. One coach works in three broad bands, another in five, another in eight, and none of them is wrong, because each is describing the same underlying physiology at a different resolution.
This article works from that physiology up. First, what’s actually happening in the body and where the real boundaries sit. Then how coaches turn those boundaries into endurance training zones, the anchors used to define them, how to choose between those anchors when they disagree, and how to assign and maintain zones for the athletes you coach.
Key Takeaways for Coaches
- A training zone is a band of intensity drawn on a continuous physiological spectrum, and the science fixes the landmarks while the coach decides how many bands to draw around them.
- The two real biological boundaries are the aerobic threshold (LT1) and the lactate threshold (LT2), and both are gradual transitions rather than hard lines in the muscle.
- Three-zone, five-zone, and larger models all describe the same physiology at different resolutions, so a coach should be able to translate any plan onto whichever scheme they use.
- Every zone is only as good as its anchor, and the four anchors (maximum heart rate, threshold, critical speed or power, and perceived exertion) each measure something different and fail in different conditions.
- When two anchors disagree, the right one to trust depends on the session and the conditions: threshold for steady aerobic work, pace or power for short fast efforts, and effort when heat or fatigue distorts the rest.
- Zones drift as fitness changes, and an athlete training to stale zones absorbs the wrong stimulus with no visible signal until a re-test exposes it.
What a Training Zone Actually Is
A training zone is a band of exercise intensity tied to a physiological anchor, with each band targeting a specific adaptation. A coach uses zones to prescribe how hard an athlete works without relying on guesswork. The anchor can be heart rate, a metabolic threshold, pace or power, or perceived effort. Whatever the anchor, the zone stands in for a state inside the body.
That last point is the one that matters. The number on the watch is a proxy. When a plan prescribes an easy aerobic session, it isn’t really asking for a heart rate of 140. It’s asking for a metabolic state: mostly fat-fueled, lactate stable, an effort the athlete could hold for hours. Confuse the marker for the state, and the prescription quietly stops meaning what it was supposed to.
Here’s where that goes wrong. A runner does an easy session at 5:30 per kilometer on a cool morning, heart rate at 145, comfortably aerobic. Two weeks later the same athlete runs the same 5:30 on a humid afternoon, and heart rate climbs to 158. The pace didn’t change; the physiological cost did. Anchor that zone to pace and the session still looks correct in the log. Anchor it to heart rate and the athlete has drifted into harder work without touching the pace. Same workout on paper, two different stimuli in the body. That’s why the choice of anchor decides everything downstream.
The runner example marks a distinction worth noting. Pace and power are external load: the work the athlete produced, measurable from outside, the same number in any weather. Heart rate and perceived effort are internal load: what that work cost this athlete on the day. A zone gets prescribed in one and paid for in the other. The two track each other closely most of the time, which is why the gap only surfaces on days like the humid one. When they part company, the gap is information rather than noise.
The Physiology Underneath Every Zone

Two points along the intensity gradient matter more than any others. They’re the places where the body’s relationship to lactate changes, and almost every zone system ever built is organized around them, whether the chart names them or not. Faude, Kindermann, and Meyer, in a 2009 review in Sports Medicine, describe these as the boundaries of the “aerobic-anaerobic transition,” the stretch of intensity where the body shifts from comfortably aerobic to increasingly anaerobic. Understanding those two points is what lets a coach read any zone scheme and know what it’s actually targeting.
The Aerobic Threshold (LT1)
The first landmark is the aerobic threshold, often labeled LT1. It’s the lowest intensity at which blood lactate rises measurably above its resting level. Below it, the athlete burns a high proportion of fat, lactate is produced and cleared in balance, and the effort can be sustained for hours. This is the intensity that builds the aerobic engine: mitochondrial density, capillary networks, fat-burning capacity. It’s also the upper boundary of what most charts call Zone 2. The reason easy running, easy riding, and easy swimming all feel similar despite wildly different paces is that they’re governed by the same physiological ceiling. The pace is sport-specific. The threshold underneath it is not.
The Lactate Threshold (LT2)
The second landmark sits higher and matters more for race performance. LT2, the lactate threshold or anaerobic threshold, is the intensity above which lactate production outpaces clearance and blood lactate climbs steeply. It corresponds closely to the maximal lactate steady state, the hardest effort an athlete can hold without lactate spiraling upward, near the fastest pace a trained athlete could race for about an hour. LT2 is the most trainable performance marker most endurance athletes have. Raising it lets the athlete hold a faster pace before fatigue accelerates, which is why threshold work earns so much attention in a build phase. It also forms the boundary between the moderate and hard ends of every zone system.
Why the Boundaries Are Transitions, Not Lines
Here’s the part that gets lost when a threshold becomes a single number on a spreadsheet. Neither LT1 nor LT2 is a switch. Faude and colleagues are explicit that these are transitions, regions of intensity where the metabolic balance gradually tips, not points where one state ends and another begins. An athlete sitting at the very top of their LT1 zone is physiologically almost identical to the next zone just above it, because the body doesn’t know it crossed a line on a chart. So a zone boundary is better treated as a soft edge than a hard wall. That single reframe prevents a lot of overprecision. Treated as a soft edge, an easy run that averages three beats into Zone 3 isn’t something to correct. The body a beat over the line is nearly identical to the body a beat under it. The physiology is forgiving at the edges in a way the spreadsheet is not.
Why Coaches Slice the Spectrum Differently
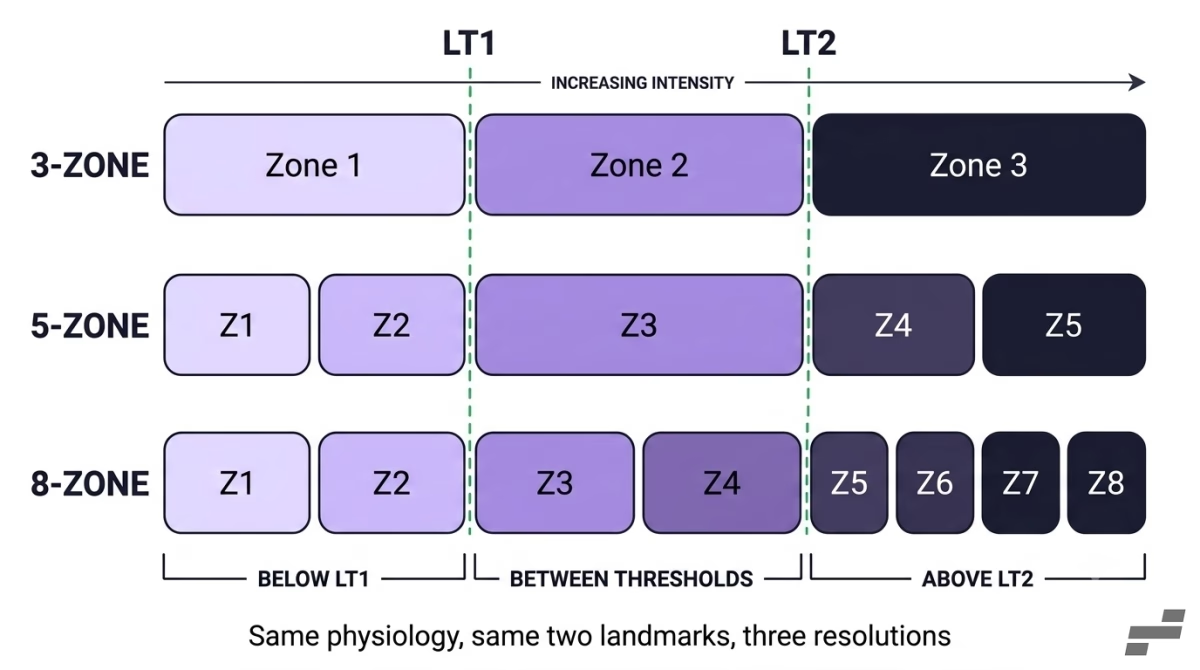
The physiology gives every coach the same two landmarks. What it doesn’t give them is a number of zones. That decision is a coaching choice, made for a purpose, and it’s the reason two well-built plans can look completely different while describing the same athlete. A three-zone plan and an eight-zone plan aren’t disagreeing about the body. They’re simply drawing at different resolutions.
Three Zones: Thinking About Training Intensity Distribution
The simplest useful model uses the two thresholds to carve the spectrum into three bands: below LT1, between LT1 and LT2, and above LT2. This is the model behind most intensity-distribution research. When Seiler and Kjerland tracked elite endurance athletes in a 2006 study in the Scandinavian Journal of Medicine & Science in Sports, they used the ventilatory thresholds to define exactly these three zones, and found the athletes spent roughly 75 to 80 percent of their training time in the lowest one. That finding only makes sense in three zones. The three-zone view answers one question well: how is this athlete’s time distributed across easy, moderate, and hard? For that purpose, more bands add noise, not clarity.
Five Zones: Prescribing the Daily Session
Most devices and most training plans default to five zones, and for good reason. Five gives a coach enough resolution to separate recovery from steady aerobic work, and threshold efforts from VO2max intervals, distinctions that matter when you’re writing a specific session rather than auditing a month. It maps cleanly onto the physiology: the bottom two zones sit under LT1, the middle straddles the threshold region, and the top two live above LT2. Detailed enough to prescribe with, simple enough to hold in your head.
More Zones: Finer Control for Specific Work
Plenty of coaches work with more. Seven-zone models split the aerobic and anaerobic ends into finer gradations, separating neuromuscular sprint work from anaerobic capacity work that a five-zone model lumps together.
The eight-zone ECOs model, developed by Cejuela-Anta and Esteve-Lanao, shows what that finer resolution buys you. Its zones are cut against the same landmarks: Z1 and Z2 sit below LT1, splitting recovery from aerobic base. Z3 occupies the band between the thresholds. Z4 sits at LT2. The four zones above it subdivide what a three-zone model would call one band, separating work just above threshold from VO2max efforts, anaerobic capacity, and neuromuscular power. That top band is a wide stretch of physiology, and a coach doing specific work up there needs to tell it apart. Each zone also carries a load weighting that climbs steeply rather than evenly, from 1 at the bottom to 50 at the top, which is how a few minutes of genuinely hard work can outweigh an easy hour. The full method is covered in our ECOs training load guide.
A finer model gives a more specific target for each session and a more sensitive record of where training actually landed. The right number of zones is the one that matches the coach’s method and the precision their anchor can support. A coach prescribing by power on a bike can justify more bands than one working from a heart-rate estimate, because the underlying measurement is sharp enough to tell those bands apart.
The Skill That Matters: Translation
Because the count is a choice, the same athlete will have different zone numbers under different systems, and none of those numbers is more true than the others. The practical skill is translation. A coach handed a plan written in seven zones should be able to map it onto their own five, or their own three, by asking one question of each prescribed effort: where does this sit relative to LT1 and LT2? Those two landmarks are the fixed reference every system shares. Anchor your reading to the thresholds, and any zone scheme becomes legible, no matter how many bands it’s been cut into.
Take the most repeated piece of zone advice there is: do more Zone 2. In a five-zone model, Zone 2 sits below LT1, so the advice means easy aerobic work. In a three-zone model, Zone 2 is the band between LT1 and LT2, which is moderate work. In the eight-zone ECOs model, Z1 and Z2 both sit below LT1, so its Zone 2 is aerobic base at the threshold itself. Same two words, three different physiological states, and only one of them is the state the advice intends. Stated against the landmark instead, it survives translation: train more below LT1. Whether your Zone 2 delivers that depends on where your system draws the line, which is exactly why the thresholds are the thing to read a plan against, not the labels.
The Four Anchors That Define Endurance Training Zones
A threshold is a physiological event. A coach can’t see it directly. What they can see is a measurement that stands in for it, and there are four to choose from. Each one tracks the underlying physiology from a different angle, and each one breaks down in its own way. Knowing what every anchor is good for, and where it loses its reliability, is what lets you set endurance training zones with intent.
Maximum Heart Rate
The most common anchor is a percentage of maximum heart rate. It’s cheap, needs no testing, and works on any device. The weakness is in how max HR usually gets estimated. The familiar 220 minus age formula is a poor predictor. Tanaka, Monahan, and Seals showed in a 2001 study in the Journal of the American College of Cardiology that 208 minus 0.7 times age fits the data far better, after pooling results from 351 studies, and that the old formula significantly underestimates max HR in older athletes. So zones built on 220 minus age tend to sit too low for a masters runner from the start.
Even with the better formula, heart rate lags a change in effort by a minute or two, drifts upward over a long session, and climbs in heat and at altitude. It’s a solid anchor for steady aerobic work in stable conditions, and the wrong tool the moment efforts get short or conditions get more demanding.
Lactate and Ventilatory Threshold
The most physiologically honest anchor is the threshold itself, measured directly. A lactate test or a ventilatory threshold (VT) test finds the athlete’s actual LT1 (or VT1) and LT2 (VT2), and zones built off those points are anchored to that specific athlete rather than a population average. This is the anchor the heart-rate formula is only ever approximating, so when a coach has threshold data, from a lab or a well-run field test, it should outrank the heart rate formula every time the two disagree. The cost is access: lab testing takes money and scheduling, and field tests take a hard effort the athlete repeats periodically as fitness changes. It’s the most accurate option and the most expensive to maintain, which is why most coaches reserve it for the athletes and phases where that level of precision is a necessity.
Critical Speed and Critical Power
Pace and power offer a third anchor, and for some work the best one. Critical speed in running and critical power in cycling mark the boundary between efforts the body can hold in a metabolic steady state and efforts it can’t. Vanhatalo, Jones, and Burnley, in a 2011 review on the application of critical power in sport, describe this boundary as the line between steady-state and non-steady-state exercise, above which oxygen cost, lactate, and muscle metabolites stop reaching a stable level. It corresponds closely to LT2, which is why critical speed and critical power work so well as practical stand-ins for the threshold.
Their advantage is that they’re immediate and condition-proof: a watt is a watt in the heat, and a pace is a pace at altitude even when heart rate has climbed. That makes power and critical speed the strongest anchor for short, fast efforts where heart rate lags behind. The limit is that pace is distorted by hills, wind, and terrain, and power meters remain more common on the bike than on the run.
Rate of Perceived Exertion
The last anchor needs no device at all. Rate of perceived exertion, the athlete’s own read on how hard the effort feels, self-corrects for everything the others miss. On a hot day, when pace overstates the real cost and heart rate climbs, RPE moves with the actual strain. The talk test is a simple field version: comfortable conversation sits below LT1, broken speech marks the threshold region, and single words mean the athlete is above LT2. RPE gets dismissed as imprecise, and for a new athlete it often is, since calibrating it takes time. For an experienced athlete it becomes remarkably accurate, and it’s the backstop every other anchor gets checked against. When the watch says one thing and the athlete’s effort says another, the effort is usually closer to the truth.
When Anchors Disagree: A Coach’s Decision Framework
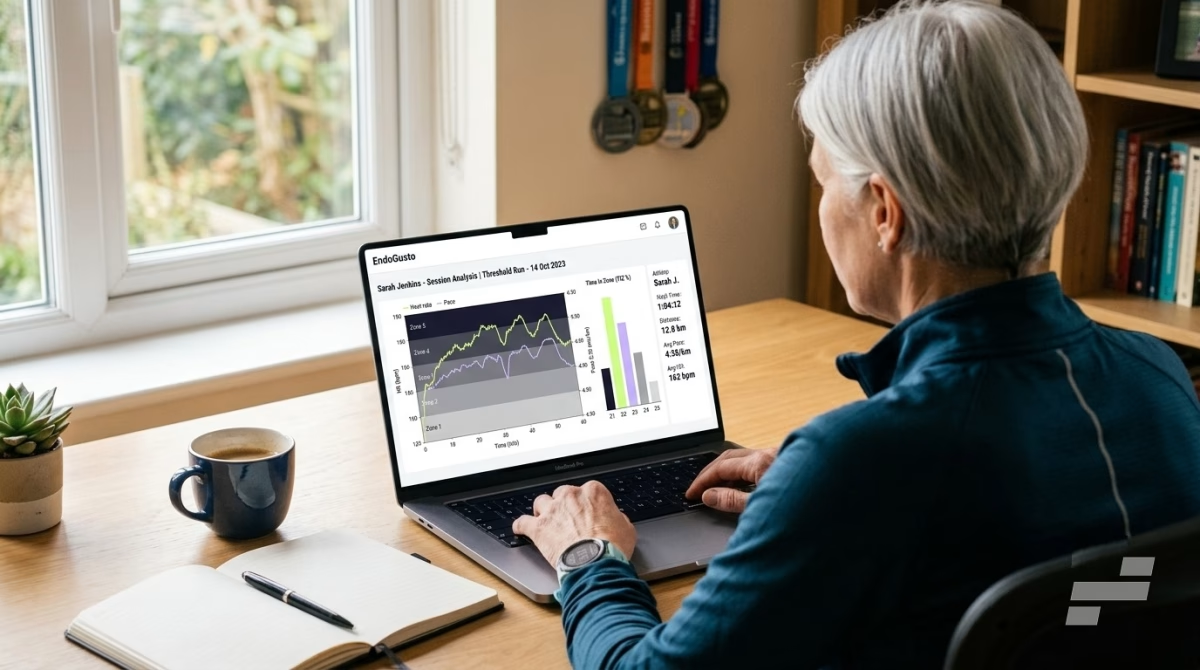
Put four anchors on the same athlete and they won’t all agree. An athlete’s heart-rate Zone 2 ceiling, set from a formula, might sit at 150. Their lactate-tested LT1 might land at 142. Same athlete, same easy run, two different ceilings eight beats apart. This is the situation a coach actually faces, and no chart resolves it. The resolution comes from knowing which anchor to trust for the job in front of you.
The principle is simple to state. Trust the anchor that tracks the physiology most directly for that session, in those conditions, and demote the others to cross-checks. What changes is which anchor wins, because it shifts with the type of work and the environment.
Steady Aerobic Work: Threshold Leads
For the bulk of training, the long easy volume below LT1, the threshold anchor is most trustworthy and pace or power backs it up. Heart rate is a useful cross-check, but it drifts, so a runner ninety minutes into an easy effort may see heart rate creep into the next zone while pace and effort confirm the work is still easy. Believe the pace and the effort, not the drift. The exception is heat: on a hot day, heart rate and RPE both rise honestly while pace overstates how easy things are, so effort becomes the anchor and the athlete accepts a slower pace for the same cost.
Short, Fast Efforts: Pace or Power Leads
The moment efforts get short, heart rate falls apart. In a 60-second interval it’s still climbing toward the effort as the rep ends, so it never describes what the athlete actually did. Here pace or power leads, because both are instantaneous. A coach prescribing 400-meter repeats anchors them to target pace, not a heart-rate zone the athlete can’t reach inside the rep, with RPE as the live check on cost. Heart rate becomes useful only afterward, in the recovery between reps, where its fall signals readiness for the next one.
Distorting Conditions: Effort Leads
Heat, altitude, fatigue, and poor sleep all pull the anchors apart. In each case pace stays the same number while costing more, heart rate climbs, and RPE rises to match the real strain. When they diverge like this, effort is the honest one. An athlete running their normal threshold pace on a humid afternoon at a heart rate eight beats high, feeling like it’s harder than threshold, is being told the truth by the feeling and a lie by the pace. The smart coaching move is to respond to the effort and let pace give.
Here’s the framework in one view. The table reads as which anchor to lead with for a given session type and condition, with the others demoted to cross-checks.
| Session type/condition | Lead anchor | Cross-check | Demote |
| Easy aerobic volume, stable conditions | Threshold (or pace/power) | RPE | Heart rate (drifts late) |
| Threshold and tempo work | Threshold / critical speed | RPE | Heart rate (lags onset) |
| Short intervals (under ~2 min) | Pace or power | RPE | Heart rate (never catches up) |
| Long efforts in the heat | RPE | Heart rate | Pace (overstates ease) |
| Altitude or high fatigue | RPE | Heart rate | Pace (overstates ease) |
One Athlete, Three Sessions
Take a single runner through a week to see the framework move. On Monday’s easy hour, the coach anchors to pace and effort, glances at heart rate, and ignores the late drift. On Wednesday’s threshold session, critical speed leads and effort confirms, while heart rate is read only as a rough second opinion because it lags at the start of each rep. On Saturday’s short intervals, target pace is the only anchor that means anything during the work, with effort riding alongside and heart rate watched only in the recoveries. Same athlete, same week, three different lead anchors, each chosen because it tracked that day’s physiology better than the others. That’s the skill the four-anchor framework is really supporting.
Setting and Applying Zones to Your Athletes
Onboarding a new athlete means setting their zones before you have much data to go on. The goal on day one is a sensible starting point rather than a final answer: zones close enough to guide good training while you learn how the athlete actually responds. Start from whatever they bring you and treat that first set as a working estimate, one that sharpens with every real effort the athlete produces. What matters early is not precision but a set of zones you can start training to and refine as you go.
What You Can Set on Day One
Most new athletes arrive with something usable: a recent race, a hard solo effort, a parkrun time. A recent race result gives a decent estimate of LT2, since for a trained athlete the threshold sits near one-hour race pace, and from LT2 you can map the rest. For an athlete with no recent racing, a simple field test, a sustained 20- to 30-minute time trial, produces a threshold pace and heart rate to build from. The mechanics of running those tests live in our threshold training guide. When an athlete arrives with nothing to test yet, a starter zone model gives you a safe place to begin, held as a draft you expect to replace once they’ve produced a real effort to anchor to. The aim is to move onto zones the athlete earned as soon as you have them.
What to Defer
Resist the urge to set everything at once. The top-end zones, the VO2max and anaerobic bands, are hard to place accurately until you’ve watched the athlete do fast work. Set the aerobic zones first, since that’s where most early volume goes, and leave the sharp end provisional until you have interval data to refine it. The athlete loses nothing by training their easy and threshold work to solid zones while the top end waits for real data.
Matching the Anchor to the Athlete
The anchor a system is built on depends on two things: what you can measure for the athlete, and what the athlete can execute. A cyclist who rides with power can train to power zones; a runner with a watch trains to pace and heart rate. But equipment doesn’t settle it. A beginner who shows up with a power meter still lacks the internal calibration to hold a tight zone, and drilling them on precise targets teaches them to chase numbers instead of learning what the efforts feel like. For that athlete the working anchor is perceived effort, a ceiling they hold to as they ramp up volume, with pace or power recorded underneath as data you’ll lean on later. An experienced athlete who already knows what threshold feels like can train to the numbers directly, because for them the effort and the number agree.
That’s why a coach often keeps more than one system in play across a roster: an effort-based structure for athletes still building that calibration, a threshold- or power-based one for athletes who have it. On EndoGusto you can create multiple zone systems and assign the one that fits each athlete’s developmental phase.
Re-anchoring Across a Season
A zone system doesn’t go stale, but the numbers you anchor it to do. The system says Zone 4 sits at threshold, and that holds however fit the athlete becomes. But the pace and heart rate you tied to threshold in week one belong to the athlete you tested in week one, and eight weeks of good training move that landmark to a faster pace. The structure is fine; its inputs have aged. That’s an easy error to miss, because nothing on the watch announces it: the zones still display, they’re just calculated from last month’s physiology.
The Two Signals the Numbers Have Drifted
Two patterns say the numbers have drifted, and they point in opposite directions. The first is fitness outrunning the anchors. At the same heart rate, the athlete now holds a faster pace than they did two months ago, their easy runs feel too easy at the prescribed ceiling. And at threshold effort they can hold a faster pace than the threshold value on record. The system is still right; the values are lagging behind a fitter athlete, and training to the old numbers now leaves adaptation on the table.
The second points the other way. The athlete’s effort climbs at a pace that used to sit comfortable, or heart rate runs high for the same work across several sessions. This is internal cost rising while the external work holds steady, the same split between what a session demands and what it costs the athlete on the day. It usually means accumulated fatigue rather than a fitness gain, a different problem with a different fix. Telling the two apart is the real skill: rising fitness calls for new anchor values, while rising cost at a fixed pace calls for recovery before any retest.
How Often to Re-Anchor
A full retest every week is overkill and disruptive. The practical cadence is to re-anchor at the natural seams of a training block, roughly every six to eight weeks, or whenever the signals above show up clearly in the log. Much of this reads passively from data you already collect: tracking pace at a fixed heart rate over a block, the kind of decoupling that shows whether the aerobic engine is still responding, tells you when a formal retest is worth scheduling. The retest itself doesn’t have to be elaborate. The same field effort you used to set the anchor, repeated under similar conditions, shows whether the threshold has moved and by how much. Update that one number and the whole system re-expresses itself around it, so the athlete is training to their current physiology rather than the fitness they started the block with.
When the Athlete Outgrows the Anchor
Sometimes what changes isn’t a number but the athlete’s readiness for a different anchor. A runner who started on perceived effort, because that was what they could execute, eventually develops a dependable sense of pace and a threshold worth testing. That’s the moment to move them onto a threshold- or pace-based system, not because the first one failed but because they’ve grown into a more precise one. It’s a deliberate progression that happens once or twice in an athlete’s development, not something you revisit every block. And effort never fully leaves the toolkit: through any hard ramp in volume, a perceived-effort ceiling still keeps easy days from creeping into moderate ones.
Zones Are a Tool, Not a Verdict
Three layers sit behind every prescription, and they move at different speeds. The physiology is fixed: two thresholds and a continuous gradient between them, the same across every endurance sport. The system, how many zones you draw and which anchor you build them on, is a coaching choice that holds steady for an athlete until they outgrow it. The third layer is the athlete’s own numbers, the threshold pace and heart rate the system is anchored to. This is the layer that moves: as the athlete gets fitter, these are the values that change, so this is the one you watch and refresh.
That upkeep is what makes a zone worth trusting past the day it was set. The coach who picks the right anchor for the athlete, reads the boundaries as transitions rather than walls, and refreshes the numbers when fitness moves is the one whose prescriptions still mean something in week twelve. A zone is only ever as honest as the last time someone checked the numbers behind it.
Coach Every Athlete to Their Own Zones With EndoGusto
The hardest part of zone training isn’t the theory. It’s keeping zones current and individual across a whole roster, when every athlete has a different anchor and a different rate of change. EndoGusto lets coaches build their own training zones and apply them to each athlete directly, so the threshold pace you set for one runner, the power zones for a cyclist, and the heart-rate bands for a beginner all live where you can see them, adjust them, and re-anchor them when a retest shows the physiology has moved.

Build Smarter Training Zones With EndoGusto
Suggested References
- Faude, O., Kindermann, W., & Meyer, T. (2009). Lactate threshold concepts: how valid are they? Sports Medicine, 39(6), 469–490. https://pubmed.ncbi.nlm.nih.gov/19453206/
- Seiler, K. S., & Kjerland, G. Ø. (2006). Quantifying training intensity distribution in elite endurance athletes: is there evidence for an “optimal” distribution? Scandinavian Journal of Medicine & Science in Sports, 16(1), 49–56. https://pubmed.ncbi.nlm.nih.gov/16430681/
- Tanaka, H., Monahan, K. D., & Seals, D. R. (2001). Age-predicted maximal heart rate revisited. Journal of the American College of Cardiology, 37(1), 153–156. https://www.jacc.org/doi/10.1016/S0735-1097%2800%2901054-8
- Vanhatalo, A., Jones, A. M., & Burnley, M. (2011). Application of critical power in sport. International Journal of Sports Physiology and Performance, 6(1), 128–136. https://pubmed.ncbi.nlm.nih.gov/21487156/