Training Load Management in Triathlon: A Practical Guide for Coaches

Table of Contents
- Key Takeaways for Coaches
- What Training Load Actually Means in a Triathlon Training Plan
- Measuring Load Across Three Disciplines in a Triathlon Training Plan
- The Acute-to-Chronic Ratio: When to Push and When to Pull Back
- Building Load Week by Week: A Triathlon Training Plan Progression Table
- Three Load Management Mistakes That Cost Coaches and Athletes
- Turning Numbers Into Coaching Decisions
- SUGGESTED REFERENCES
A coach reviews her athlete’s training log after four weeks of consistent preparation for a half-distance race. Total weekly hours have stayed between nine and eleven. In fact, session compliance is nearly perfect. Yet the athlete’s easy-pace run splits have drifted upward by fifteen seconds per kilometer, and Tuesday’s interval sessions have quietly lost their snap.
Nothing in the weekly total explains the decline. Indeed, the hours look right. The problem is hiding underneath them.
In most cases like this, the issue isn’t how much the athlete trained. It’s how training stress accumulated across three sports without anyone noticing the creep. A steady nine-hour week can produce very different outcomes depending on how those hours distribute between swim, bike, and run, and how load changed from one week to the next.
Training load management is the layer of coaching that sits between a triathlon training plan and the athlete’s actual response to it. It answers a simple question: is the stress I’m prescribing producing adaptation, or is it quietly digging a hole?
For coaches working across 70.3 triathlon distances and IRONMAN triathlon length events, load management becomes even more consequential. As a result, the longer the race, the higher the cumulative training volume, and the smaller the margin between productive overreach and early-stage overtraining.
This article lays out a practical system for measuring, tracking, and adjusting training load across all three disciplines. You’ll find concrete tools, a working load progression table, and the most common mistakes that undermine months of otherwise solid planning.
Key Takeaways for Coaches
- Why weekly training hours can look stable while fatigue quietly accumulates underneath.
- How session RPE gives coaches a single, usable number to track load across swim, bike, and run.
- What the acute-to-chronic workload ratio reveals about an athlete’s readiness to absorb more stress.
- Where iron man triathlon length and 70.3 triathlon distances demand different load ceilings.
- Which three load management mistakes cost coaches the most race-day fitness.
What Training Load Actually Means in a Triathlon Training Plan
Most coaches track training by hours or distance. An athlete logs ten hours this week, eleven the next. The numbers go up, and the assumption is that fitness follows. But training load is not the same as training volume, and confusing the two is one of the quietest planning errors in triathlon coaching.
In other words, volume tells you what the athlete did. Load tells you what it cost. A ninety-minute easy ride at 60% of threshold and a ninety-minute ride with three twenty-minute tempo blocks both occupy the same calendar slot. They do not occupy the same place in the athlete’s recovery budget. If the training log treats them as equal, the coach is flying partly blind.
In a triathlon training plan, this distinction matters more than in single-sport coaching. After all, three disciplines compete for the same pool of recovery resources. For instance, a hard swim session in the morning doesn’t just fatigue the shoulders; it elevates systemic stress that the afternoon bike session inherits. Tracking volume alone misses these interactions entirely.
Training load, in practical terms, is a function of both duration and intensity. Several metrics attempt to capture this. Power-based models like Training Stress Score (TSS) work well for cycling, and increasingly for running. Heart rate-based models, such as TRIMP, offer an alternative when power data isn’t available. However, the most coach-friendly and universally applicable method, session RPE, requires nothing more than a single question asked after every workout.
Why Total Hours Alone Mislead Coaches
Consider two athletes preparing for a 70.3 triathlon. Both train ten hours per week. Athlete A distributes those hours as four hours of cycling, three and a half hours of running, and two and a half hours of swimming, with most sessions at moderate intensity. Athlete B trains the same total, but concentrates six hours on the bike, including two high-intensity sessions, with shorter but harder run sessions and minimal swim volume.
Their weekly totals are identical. Their fatigue profiles are not. In contrast, Athlete B is accumulating significantly more neuromuscular and metabolic stress from cycling, likely at the expense of run quality later in the week. If the coach only reviews total hours, both athletes appear to be on track. Yet Athlete B is probably one long brick session away from a breakdown.
Total hours also hide the week-to-week trajectory. Similarly, an athlete who holds steady at nine hours for four consecutive weeks might seem stable. But if the intensity distribution shifted, if zone two rides gradually became zone three efforts because the athlete felt strong, the internal cost of that “stable” block has been climbing without any visible change in the schedule. This is where load monitoring earns its value. It catches the drift that volume tracking cannot see.
Measuring Load Across Three Disciplines in a Triathlon Training Plan
Coaches sometimes avoid load tracking because the available tools seem built for sports scientists, not working practitioners. TSS requires a power meter and a reliable threshold test. TRIMP depends on accurate heart rate zones and a formula most athletes will never see. When you multiply that complexity by three sports, the system can collapse under its own weight before it produces a single useful insight.
Session RPE (sRPE), developed by Carl Foster and colleagues in the early 2000s, solves this problem. Essentially, the method is simple. After every session, the athlete rates perceived exertion on a scale of one to ten. That number is multiplied by the session duration in minutes. The result is a single load value, expressed in arbitrary units (AU), that captures both how long and how hard the session felt.
A sixty-minute easy swim rated four out of ten produces a load of 240 AU. A sixty-minute threshold run rated eight produces 480 AU. ame duration, yet double the cost. Foster et al. (2001) demonstrated that sRPE correlates well with heart rate-based load measures across multiple endurance sports, making it a reliable proxy when more complex tools aren’t practical.
For triathlon coaches, the real advantage is universality. After all, power meters don’t go in the pool. Heart rate behaves differently in water than on the bike. Yet an RPE rating after a swim session captures the athlete’s global response to that stress just as effectively as it does after a ride or a run. One system, three sports, no extra hardware.
A Working Example With Numbers
Suppose you’re coaching an athlete through a moderate training week during a build phase for a 70.3 triathlon. Here’s what a Monday-through-Sunday load profile might look like using sRPE:
Monday: 50-minute easy swim, RPE 3. Load: 150 AU.
Tuesday: 75-minute bike with tempo intervals, RPE 7. Load: 525 AU.
Wednesday: 45-minute easy run, RPE 4. Load: 180 AU.
Thursday: 60-minute swim with race-pace sets, RPE 6. Load: 360 AU.
Friday: Rest day. Load: 0.
Saturday: 150-minute long ride, RPE 5. Load: 750 AU.
Sunday: 70-minute long run, RPE 6. Load: 420 AU.
Total weekly load: 2,385 AU. Swim contributes 510, cycling 1,275, and running 600. The bike accounts for roughly 53% of total weekly stress, which is appropriate for a half-distance build. If that cycling share creeps above 60% without a deliberate reason, it’s worth asking whether the run and swim are being underserved, or whether the bike sessions have gotten harder than intended.
Tracking these numbers week to week reveals patterns that calendar reviews miss. A coach might notice that swim load has been flat for five weeks while bike and run load climbed steadily. Or that the athlete’s RPE for easy runs has crept from four to five and a half, which suggests accumulated fatigue rather than genuine improvement. These small signals, invisible in a training plan viewed by hours alone, become obvious once load is quantified.
Importantly, sRPE also respects subjectivity in a useful way. For instance, two athletes can complete the same workout and report different RPE values. Importantly, that difference is information, not error. It tells the coach something about individual tolerance, recovery status, or external stress that a power file alone would never reveal.
The Acute-to-Chronic Ratio: When to Push and When to Pull Back
Knowing an athlete’s weekly load is useful. Knowing how that load compares to what they’ve been absorbing over the past month is what turns a triathlon training plan from a schedule into a coaching tool. That comparison is the core idea behind the acute-to-chronic workload ratio (ACWR), a concept that has become central to injury prevention research in team sports and is equally applicable to endurance coaching.
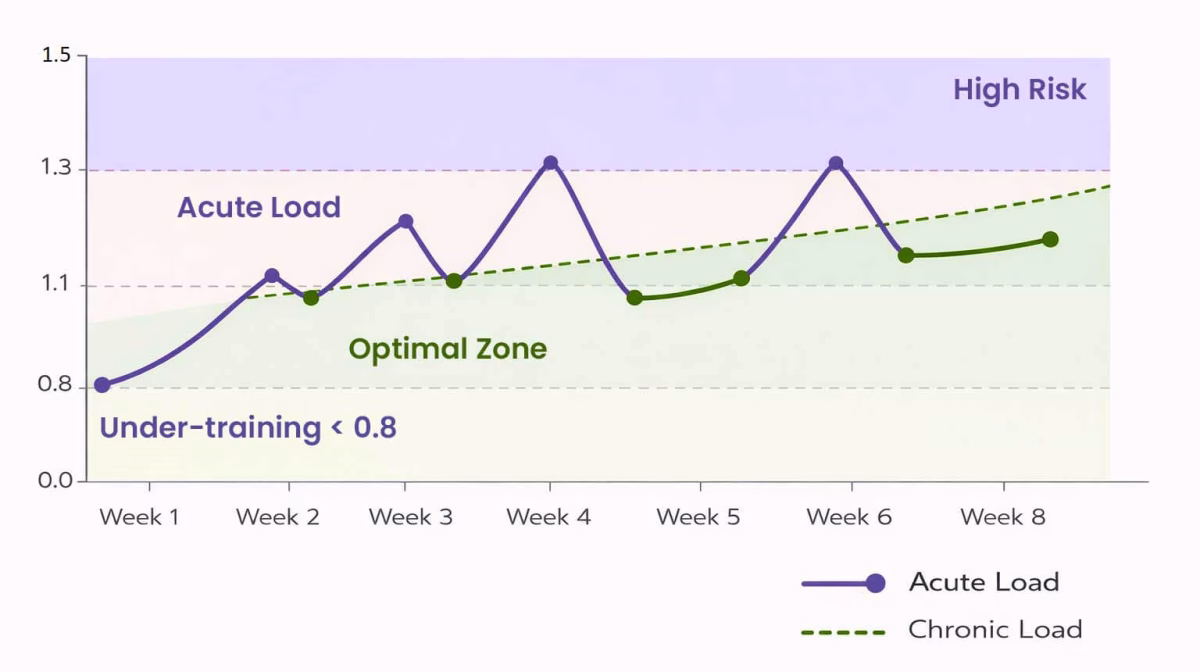
Fortunately, the calculation is straightforward. Acute load is the current week’s total (typically the most recent seven days). Chronic load is the rolling average of the previous three to six weeks. Divide acute by chronic, and the result tells you whether training stress is rising, stable, or declining relative to what the athlete’s body has been prepared to handle.
Tim Gabbett’s research, particularly his 2016 work on training load and injury risk in team sport athletes, established a practical guideline that coaches across disciplines have since adopted. An ACWR between 0.8 and 1.3 represents a productive training zone. Specifically, below 0.8, the athlete may be undertrained and losing the protective effect of consistent load. Above 1.3, injury and overtraining risk climb sharply. Spikes beyond 1.5 are where most non-contact soft tissue injuries cluster.
What This Looks Like in Practice
Take a triathlon coach working with an athlete whose chronic weekly load (four-week rolling average) sits at 2,200 AU. If next week’s planned load totals 2,400 AU, the ACWR is approximately 1.09. In practice, that’s a moderate, well-tolerated increase. However, if the coach programs a big overreach week at 3,100 AU, perhaps adding a long brick session and an extra swim, the ratio jumps to 1.41. On the other hand, it might look like an ambitious but manageable push on paper. In practice, that single spike puts the athlete in a higher-risk zone, especially if it follows several weeks of gradually rising load.
This is where the ACWR earns its keep. It doesn’t tell the coach what sessions to program. It tells the coach whether the overall trajectory is sustainable. A planned step-up week can still be aggressive, but the ratio provides a guardrail. If a coach sees the number approaching 1.3, the question becomes practical: which session can be shortened, or dropped to a lower intensity, to keep the week productive without crossing the threshold?
Load Ceilings Shift With Race Distance
The ACWR framework applies across all triathlon distances, but the numbers it operates on are very different depending on the target race. For example, an athlete preparing for a sprint triathlon might carry a chronic load of 1,200 to 1,500 AU. Someone building toward 70.3 triathlon distances will likely sit between 2,000 and 3,000. For full-distance racing, chronic loads of 3,500 to 5,000 AU are common during peak training blocks, depending on the athlete’s experience and training history.
This matters because a 400 AU jump means something different at each level. For the sprint athlete with a chronic load of 1,300, adding 400 AU in a single week pushes the ACWR to roughly 1.31, right at the upper edge. For the full-distance athlete sitting at 4,000 AU chronic, that same 400 AU increase barely registers at 1.10. Coaches need to scale their load expectations to the training ceiling that the target race demands. When the iron man triathlon length defines the goal, a 400 AU jump is routine. In a sprint program, that same jump could be reckless.
This also explains why athletes transitioning from shorter to longer distances are particularly vulnerable. In short, their chronic load baseline was built for a different ceiling. When a coach introduces full-distance volume too quickly, the ACWR flags the mismatch before the body does, but only if someone is tracking it.
Building Load Week by Week: A Triathlon Training Plan Progression Table
Theory is useful. A working model is better. The table below shows an eight-week load progression for an athlete preparing for a 70.3 triathlon, transitioning from late base into an early build phase. Load values use session RPE (AU), tracked per discipline and totaled weekly. The ACWR column reflects the acute-to-chronic ratio calculated against a four-week rolling average.
This is not a universal template. It’s an example of how a coach might structure load progression for a moderately experienced age-group athlete training seven to nine sessions per week. The specific numbers will differ based on individual capacity, training history, and how far out the athlete is from race day. Instead, what matters is the pattern: gradual increases, deliberate recovery weeks, and a discipline-level view that prevents any single sport from quietly dominating the load budget.
| Week | Swim (AU) | Bike (AU) | Run (AU) | Weekly Total (AU) | ACWR | Notes |
| 1 | 420 | 1,050 | 480 | 1,950 | N/A | Baseline week. Establish routine. |
| 2 | 450 | 1,150 | 520 | 2,120 | N/A | Slight increase. All sessions at planned intensity. |
| 3 | 480 | 1,250 | 560 | 2,290 | N/A | Moderate build. Long ride extends to 2.5 hours. |
| 4 | 400 | 950 | 430 | 1,780 | 0.85 | Recovery week. Volume drops roughly 20%. |
| 5 | 500 | 1,300 | 600 | 2,400 | 1.15 | Step up from new baseline. Add tempo bike intervals. |
| 6 | 520 | 1,400 | 640 | 2,560 | 1.12 | Highest load week so far. Long run reaches 90 minutes. |
| 7 | 540 | 1,500 | 680 | 2,720 | 1.10 | Peak build week. First brick session of the block. |
| 8 | 430 | 1,050 | 500 | 1,980 | 0.81 | Recovery week. Absorb prior three weeks of loading. |
Reading the Table as a Coach
Several patterns are worth noting. First, the bike consistently carries the largest share of weekly load, roughly 50 to 55%. For a half-distance athlete, this is deliberate. The 90-kilometer bike leg is where races are most commonly lost, so training stress should reflect that priority. If a coach sees swim load approaching bike load in a 70.3 program, something in the plan has likely drifted.
Second, the ACWR stays between 0.81 and 1.15 throughout the block. Consequently, no single week spikes above 1.3. The two recovery weeks (Weeks 4 and 8) bring the ratio below 0.9, which creates a brief period of relative underload that allows tissue repair and hormonal recovery before the next push. Gabbett’s research suggests that these valleys are not wasted time; they are what make the subsequent loading weeks productive rather than destructive.
Third, the run progresses more conservatively than the bike. Between Weeks 1 and 7, bike load increases by roughly 43%. Run load increases by about 42%, but from a much lower starting point. In absolute terms, the run adds only 200 AU across seven weeks while the bike adds 450 AU. This asymmetry is intentional. Running produces more orthopedic stress per hour than cycling; therefore, the rate of increase must be slower even when percentage growth looks similar. A coach who treats bike and run progression as interchangeable will eventually produce an injured runner.
Adapting the Model for Full-Distance Athletes
For athletes targeting full-distance racing, the same structure applies, but the numbers scale upward. Baseline weeks might start closer to 2,800 to 3,200 AU, with peak build weeks approaching 4,000 to 4,500. The bike share may climb to 55 to 60% during peak blocks, reflecting the dominance of the 180-kilometer leg. Recovery weeks still target an ACWR around 0.80 to 0.85, but the absolute volume in those recovery weeks, perhaps 2,600 AU, would constitute a build week for a shorter-distance athlete.
The key coaching judgment is knowing where the athlete’s current ceiling sits and ensuring the plan never asks them to jump more than 10 to 15% above what they’ve recently absorbed. The table provides the scaffolding. The coach provides the adjustment.
Three Load Management Mistakes That Cost Coaches and Athletes
Load management errors rarely announce themselves. They accumulate quietly over weeks and surface as plateaus, unexplained fatigue, or injuries that seem to come from nowhere. These three patterns are among the most common, and each one is preventable once a coach knows what to watch for.
Chasing Bike Volume at the Expense of Run Freshness
Cycling is the easiest discipline to add volume to. It’s low impact, psychologically enjoyable for most athletes, and produces satisfying training metrics. A coach can extend a Saturday ride from two and a half hours to three and a half hours without triggering the same alarm bells that a ninety-minute run would. As a result, the bike grows. And grows. And because the weekly total still looks reasonable, nobody questions it.
The cost shows up in the run. An athlete who finishes a three-hour Sunday ride with a load of 900 AU starts Monday already carrying significant residual fatigue. If Tuesday holds a key run session, that session is now compromised before it begins. Over several weeks, the athlete’s running never gets a clean training stimulus. The legs always feel slightly heavy. Pace stagnates. The coach adds more run volume to compensate, which only deepens the problem.
The fix is straightforward but requires discipline. Track bike and run load separately, not just as a combined total. For a 70.3 triathlon training plan, cycling should carry the largest share, but it should not crowd the run out of its recovery window. If a long ride falls on Saturday, the key run session needs at least 36 to 48 hours of separation, or the run should be deliberately easy in the days following.
Ignoring the Cumulative Cost of Swimming
Swimming rarely appears in conversations about overtraining in triathlon. Certainly, the distances are shorter. The perceived effort often feels lower than cycling or running. And because swim sessions don’t produce the same delayed-onset muscle soreness, coaches and athletes alike tend to underestimate what they cost.
Yet a 4,000-meter session with race-pace intervals and threshold sets is not trivial. The shoulders, lats, and core absorb genuine mechanical stress. In fact, heart rate during hard swim efforts often reaches levels comparable to threshold cycling. Importantly, swim fatigue is systemic. Specifically, it elevates cortisol, depletes glycogen, and compresses the recovery window for whatever session comes next.
A coach who programs a hard 60-minute swim (RPE 7, load 420 AU) on the morning before an afternoon tempo ride has effectively front-loaded the day with invisible stress. The ride might look fine on paper. The athlete’s power numbers might even hold. But the internal cost of that ride, measured by recovery time and accumulated fatigue, is higher than it would have been without the swim. Over a mesocycle, these hidden taxes compound.
The solution is to treat swim sessions as real contributors to weekly load, not as recovery fillers. When using sRPE, the numbers make this visible. If swim load accounts for less than 15% of total weekly stress in a half-distance plan, it might genuinely reflect a proportional distribution. However, if a coach never looks at swim load as a distinct category, the risk of underestimating its contribution remains.
Flat-Loading: Same Weekly Total for Six Weeks Straight
Consistency is a coaching virtue. Flat-loading is not. When an athlete holds the same weekly total, say 2,300 AU, for six consecutive weeks without variation, two things typically happen. First, the body adapts to that stimulus and stops responding to it. Second, micro-level fatigue accumulates without any recovery window to clear it.
The ACWR in a flat-loaded block hovers around 1.0 for weeks. It looks safe. It is deceptively stale. In other words, the athlete isn’t overreaching, but also isn’t progressing. Adaptation requires stress that exceeds what the body is accustomed to, followed by a period of reduced load where tissue repair and fitness consolidation actually occur. Without that oscillation, training becomes maintenance at best and stagnation at worst.
The eight-week table in the previous section illustrates the alternative. Load rises for three weeks, drops in week four, rises again for three weeks, then drops again in week eight. This pattern, sometimes called a 3:1 loading cycle, ensures that both the stimulus and the recovery are built into the triathlon training plan rather than left to chance. Coaches who resist recovery weeks because they fear lost fitness are, in fact, sacrificing the mechanism that produces it.
Turning Numbers Into Coaching Decisions
Load management is not about spreadsheets. It’s about giving coaches a language for the decisions they already make intuitively. A good triathlon training plan sharpens those decisions with data that the training calendar alone can’t provide.
A weekly total tells you what happened. A discipline-level load breakdown tells you where the stress actually landed. An acute-to-chronic ratio tells you whether next week’s plan is building fitness or borrowing against future recovery. None of these tools replace coaching judgment. They inform it.
The coaches who manage load well tend to share a habit. They look at the plan from the athlete’s body outward, not from the calendar inward. Instead, they ask what this week costs, not just what it contains. Over a season, that distinction separates the athletes who arrive at the start line healthy and ready from those who arrive overtrained or undertrained and wondering what went wrong.
Start simple. Track sRPE for two weeks. Review the numbers by discipline. The patterns will speak for themselves.

Build Smarter Triathlon Training Plans With EndoGusto
SUGGESTED REFERENCES
- Foster, C., Florhaug, J.A., Franklin, J., Gottschall, L., Hrovatin, L.A., Parker, S., Doleshal, P. and Dodge, C. (2001). A new approach to monitoring exercise training. Journal of Strength and Conditioning Research, 15(1), 109–115.
- Gabbett, T.J. (2016). The training-injury prevention paradox: should athletes be training smarter and harder? British Journal of Sports Medicine, 50(5), 273–280.