ECOs vs Training Stress Score: A Guide for TSS-Fluent Coaches

Table of Contents
- Key Takeaways for Coaches
- What ECOs and Training Stress Score Share
- Where the Two Models Differ
- A Worked Example: One Hour at Threshold
- Reading Weekly Load After You Switch
- What Transfers, and What You’ll Relearn
- Choosing What the Number Answers
- Where ECOs Fits in EndoGusto
- Suggested References
You coach a runner through two sessions in the same week. Tuesday is a track workout, sixty minutes door to door, mostly easy with a brutal twelve minutes of intervals in the middle. Sunday is ninety minutes of steady aerobic running. Ask which one loaded the athlete more, and the honest answer depends entirely on how you keep score.
If you already run your athletes on Training Stress Score, you have a calibrated instinct for this. You know roughly what a week should total and what a hard day looks like on the chart. ECOs answers the same question, the load of a session, but with a different method. The two scores will not line up one to one, and understanding the difference will make the switch that much easier.
This guide is for coaches who already think in TSS. We will cover where the two models agree, where they genuinely differ, and how to bring your TSS intuition across to ECOs. Here is the short case for the switch: ECOs sorts intensity into physiological zones and weighs every sport on one scale, so the score itself carries more of the judgment you now make by feel. For a multisport coach, that means one weekly figure instead of three tallies to reconcile. For a runner, it means a sharper read on where the hard minutes land. Most of this applies whether you coach runners, cyclists, swimmers, or all three.
ECOs was developed by Roberto Cejuela and Jonathan Esteve-Lanao and published in a peer-reviewed sport science journal in 2011. Cejuela is a full professor at the University of Alicante and an Olympic triathlon coach, with athletes at both the Tokyo and Paris Games, so the model was shaped by the real demands of training at the top of the sport. That pairing of published science and elite coaching is exactly what we identify with at EndoGusto, and it is why we built the platform on ECOs.
Key Takeaways for Coaches
- Both models reject the idea that an hour is an hour, and both weigh hard minutes far more heavily than easy ones.
- The biggest difference is cross-sport: TSS normalizes each sport to its own threshold, while ECOs applies a separate exercise factor to each discipline.
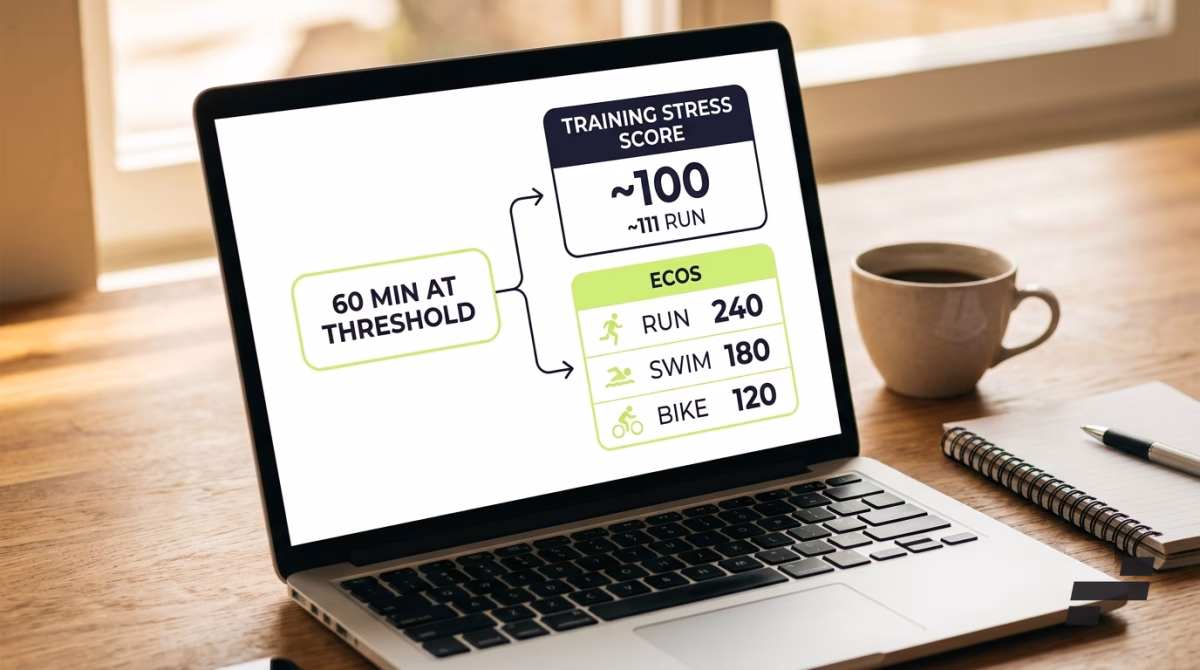
- An hour at threshold scores about 100 in any TSS sport, but in ECOs it scores roughly 240 running, 180 swimming, and 120 cycling.
- No single conversion factor maps weekly TSS onto weekly ECOs, because the two use different units, structures, and cross-sport rules.
- Your coaching eye transfers intact, but your absolute reference points reset, rebuilding easily with two or three weeks of your athletes’ own data.
What ECOs and Training Stress Score Share
Start with the agreement, because it runs deeper than most coaches expect. Both models were built to override the same bad assumption, that an hour is an hour. Neither one lets a steady spin and a savage interval session count the same just because the clock says they lasted equally long.
They also handle intensity the same way in spirit. Both weigh hard work disproportionately. Training Stress Score does it inside Normalized Power, which takes a 30-second rolling average of your power, raises each value to the fourth power, averages those, then takes the fourth root. That fourth power is what makes a surge cost far more than a linear bump would suggest. ECOs reaches the same end through eight zone weights that climb 1, 2, 3, 4, 6, 9, 15, 50. The mechanisms look nothing alike, yet both plot intensity on a curve rather than a straight line.
Take the runner from the intro. On both models, the Tuesday track session can outscore the longer Sunday run, even though Sunday ran thirty minutes longer. The twelve hard minutes carry weight that flat aerobic running never reaches. Any coach who has watched a short, sharp session leave an athlete flatter than a long easy one already knows the reality of this.
Two more points of agreement matter. First, both models read external load before internal load, trusting power and pace ahead of heart rate. Second, both roll up over time to track fitness and fatigue, rather than living as isolated session numbers. Training Stress Score itself descends from Banister’s heart-rate TRIMP, reworked by Andrew Coggan around power. ECOs grew from the same family tree on a separate branch. In short, these are cousins, not strangers.

Where the Two Models Differ
The two models differ in two places. First, ECOs sorts intensity into eight physiological zones, while Training Stress Score uses one continuous ratio to threshold. Second, ECOs weighs each sport differently, whereas TSS normalizes every sport to its own threshold. Both make hard minutes count. ECOs simply builds more of the comparison into the number itself.
Eight Zones vs a Continuous Threshold Ratio
This difference applies to every athlete you coach, including the runner who never touches a bike. Training Stress Score treats intensity as a single sliding ratio. It compares your Normalized Power, or Normalized Graded Pace for running, against one threshold value, and the score climbs smoothly as that ratio rises. There are no internal steps. A session is more or less intense by degree.
ECOs instead drops each minute into one of eight zones anchored to physiological landmarks, the first and second lactate thresholds and the VO2max region above them. Every minute in a zone earns that zone’s fixed weight. As a result, the score moves in deliberate jumps rather than a smooth slope.
For a runner, the practical effect shows up at the edges. Consider a fartlek session that drifts between the top of zone three and the bottom of zone five. Under a continuous ratio, that drift averages into one intensity figure. Under zones, the minutes spent above threshold get pulled into a heavier weight and counted separately from the tempo stretches. Neither approach is more correct. They simply answer “how hard” with different resolution, and ECOs makes the high-intensity minutes more visible in the final number.
One Scale Across Sports, or One Scale Per Sport
If you coach more than one sport, this is the difference you will feel most. Training Stress Score normalizes every discipline to its own threshold. So an hour at threshold reads near 100 whether your athlete ran it, rode it, or swam it. The model deliberately holds the threshold hour equal across sports, which keeps each sport internally consistent.
ECOs makes the opposite choice. It applies a separate exercise factor to each discipline, running at 1.0, swimming at 0.75, and cycling at 0.5. Consequently, the same relative hour costs more in running than in cycling, by design. The reasoning, which the original method grounds in technical demand, muscle damage, session density, and energy cost, is covered in ECOs Training Load Explained and worth reading if you want the full rationale.
The takeaway here is narrow. TSS keeps sports separate and equal at threshold. ECOs makes them directly comparable on one weighted scale. For a single-sport coach, this changes little. For anyone juggling two or three, it changes the whole picture of where weekly load is landing.
The table below lines up the two models on the dimensions that matter most for multisport training load.
| Dimension | Training Stress Score | ECOs |
| Intensity input | Normalized Power or Graded Pace against one threshold | Time spent in eight physiological zones |
| Intensity weighting | Fourth-power smoothing inside NP and NGP | Exponential zone weights, 1 to 50 |
| Cross-sport handling | Each sport normalized to its own threshold | Separate exercise factor per discipline |
| Heart rate | Backup only (hrTSS), flagged as less accurate | Backup only, below pace and power |
| Brick sessions | No native transition premium | Transition premium added to the second sport |
| Built-in reference | Threshold hour anchored at 100 | No fixed per-hour anchor |
A Worked Example: One Hour at Threshold
Numbers make this concrete faster than any explanation. Take one clean input, sixty minutes held right at threshold, and run it through both models.
Under Training Stress Score, an hour at threshold is the definition of 100. That is the anchor the whole scale is built on. For running, though, the figure usually comes in a little higher. Normalized Graded Pace applies the same fourth-power smoothing that Normalized Power does, and that math nudges the effective pace above your true average. As a result, a threshold running hour tends to score closer to 111 in rTSS rather than a flat 100. The number is not wrong. It simply reflects how NGP weighs a run.
Now run the same hour through ECOs. An hour at threshold sits in zone four, which carries a weight of 4. The score is the time in that zone, multiplied by the zone weight, multiplied by the exercise factor:
- Running: 60 × 4 × 1.0 = 240
- Swimming: 60 × 4 × 0.75 = 180
- Cycling: 60 × 4 × 0.5 = 120
Treat those absolute numbers as illustrative. The relationship is the part that holds: in ECOs, a threshold hour of running costs exactly twice a threshold hour of cycling. In TSS, both sit near 100. That single contrast captures the entire design gap between the two models.
Why There’s No Clean Conversion Factor
Coaches switching scales always ask for the exchange rate. There isn’t one. The two models use different units, different internal structures, and a different rule for comparing sports, so no constant maps weekly TSS onto weekly ECOs. A factor that worked for a pure cyclist would break for a runner, and both would break for anyone training across disciplines. Instead of converting numbers, rebuild your reference points directly from your own athletes, which is faster than it sounds.
Reading Weekly Load After You Switch
Here is where most of the friction lands. Your weekly TSS targets and your CTL ramp are reference points, and none of them transfer numerically to ECOs. The scales are simply different, so a number that meant “solid build week” in TSS means nothing on sight in ECOs. Expect to feel briefly unmoored, then rebuild.
What does carry over is shape, and shape is most of the job. The ramp still matters. Whether load is climbing, holding, or dropping into recovery reads the same on any scale, even when the raw numbers change. The balance across an athlete’s sports still matters, and ECOs actually sharpens it, since the exercise factors stop an easy bike week from masquerading as equal to a hard run week. The ratio of easy load to hard load still matters too, and the non-linear zone weighting keeps that honest.
For a single-sport coach, the adjustment is small. You learn one new set of weekly figures for your runners and move on. For a multisport coach, the shift is larger but more useful, because the weekly total finally reflects the real mechanical bill across three sports rather than three separate tallies you had to reconcile by feel.
Rather than chase an absolute target on day one, watch your own roster for two or three weeks and let the patterns set your new anchors. The fitness and fatigue rollup, the part that replaces your Performance Management Chart instinct, gets its own treatment in Reading Your Performance and Training Load Balance Graphs. For now, trust the trend lines before you trust the totals.
What Transfers, and What You’ll Relearn
Most of your coaching judgment survives the switch untouched. Just a few habits will need recalibrating.
What transfers cleanly:
- Intensity discipline. Hard minutes cost more than easy minutes on both scales, so your instinct for protecting recovery still holds.
- Watching the weekly ramp. A sensible week-to-week progression reads the same in any unit.
- Distrusting raw volume. Both models stand by time alone can hide the real load, and ECOs leans into that even harder.
What you’ll relearn:
- Absolute numbers. What counts as a big session or a heavy week resets entirely.
- Cross-sport comparisons. If you coach more than one discipline, an hour is no longer an hour across sports, and the exercise factors now do that math for you.
- Your gut sense of “100.” That single most useful TSS landmark does not exist in ECOs, so you build new landmarks from your athletes’ actual weeks.
The honest summary is that you keep your coaching eye and rebuild your dashboard. The eye is the part that took years. The dashboard takes a few weeks of real data.
Choosing What the Number Answers
Switching scales is not about finding a better number. It is about choosing the question you want the number to answer. Training Stress Score keeps each sport clean and consistent against its own threshold. ECOs trades a little of that simplicity for one currency that holds across running, cycling, and swimming at once. For a coach whose athletes mostly run, the gain is sharper resolution on where hard minutes land. For a coach managing several sports, the gain is a single load figure that finally tells the truth about the whole week.
Where ECOs Fits in EndoGusto
EndoGusto calculates ECOs straight from your athletes’ uploaded files, sorting every minute into zones and applying the exercise factor before it ever reaches your screen. The full methodology, including how the score rolls up over time, lives in the companion guide.
Suggested References
- Cejuela-Anta, R., & Esteve-Lanao, J. (2011). Training load quantification in triathlon. Journal of Human Sport and Exercise, 6(2), 218–232. https://doi.org/10.4100/jhse.2011.62.03